Normandy: Climate
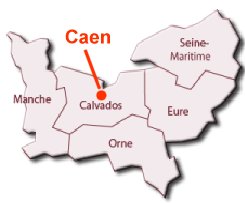
This page presents information on the climate of Normandy - specifically for the town of Caen.
Information is shown for the following categories:
- Average Temperature
- Average Maximum and Minimum Temperatures
- Average Hours of Sunshine per day
- Average Rainfall per month
- Average Number of Rainy Days per month
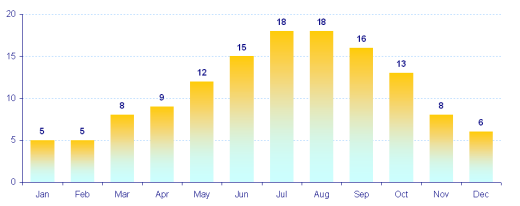
Average Temperature: Caen
The average temperature throughout the year is shown below in °C for the town of Caen, in the departement of Calvados.
| Jan | Feb | Mar | Apr | May | Jun | Jul | Aug | Sep | Oct | Nov | Dec | |
|---|---|---|---|---|---|---|---|---|---|---|---|---|
| Avg Temperature (° C) | 5 | 5 | 8 | 9 | 12 | 15 | 18 | 18 | 16 | 13 | 8 | 6 |
Click on the chart to see it in a larger format.
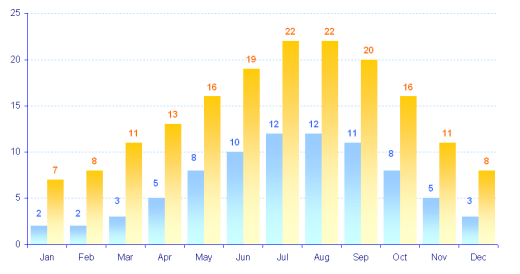
Average Maximum and Minimum Temperatures: Caen
The average maximum and minimum temperatures throughout the year are shown below in °C for the town of Caen, in the departement of Calvados.
| Jan | Feb | Mar | Apr | May | Jun | Jul | Aug | Sep | Oct | Nov | Dec | |
|---|---|---|---|---|---|---|---|---|---|---|---|---|
| Avg Max (° C) | 7 | 8 | 11 | 13 | 16 | 19 | 22 | 22 | 20 | 16 | 11 | 8 |
| Avg Min (° C) | 2 | 2 | 3 | 5 | 8 | 10 | 12 | 12 | 11 | 8 | 5 | 3 |
Click on the chart to see it in a larger format.
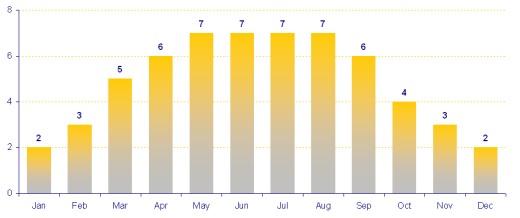
Average Hours Sunshine: Caen
The average hours of sunshine a day is shown below for the town of Caen, in the departement of Calvados.
| Jan | Feb | Mar | Apr | May | Jun | Jul | Aug | Sep | Oct | Nov | Dec | |
|---|---|---|---|---|---|---|---|---|---|---|---|---|
| Avg Hours Sun | 2 | 3 | 5 | 6 | 7 | 7 | 7 | 7 | 6 | 4 | 3 | 2 |
Click on the chart to see it in a larger format.
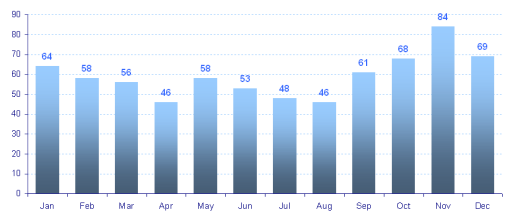
Average Rainfall: Caen
The average rainfall throughout the year are shown below in millimeters (mm) for the town of Caen, in the departement of Calvados.
| Jan | Feb | Mar | Apr | May | Jun | Jul | Aug | Sep | Oct | Nov | Dec | |
|---|---|---|---|---|---|---|---|---|---|---|---|---|
| Avg Rainfall (mm) | 64 | 58 | 56 | 46 | 58 | 53 | 48 | 46 | 61 | 68 | 84 | 69 |
Click on the chart to see it in a larger format.
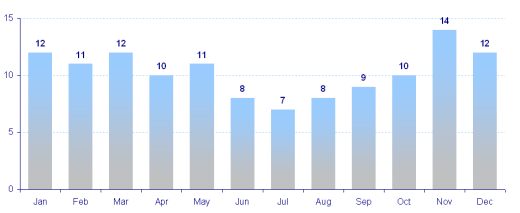
Average Rainy Days per Month: Caen
The average number of days when there is some rain throughout the year is shown below for the town of Caen, in the departement of Calvados. “Some rain” is defined as there being at least 1.0 mm of rain during the day.
| Jan | Feb | Mar | Apr | May | Jun | Jul | Aug | Sep | Oct | Nov | Dec | |
|---|---|---|---|---|---|---|---|---|---|---|---|---|
| Avg Rainy Days | 12 | 11 | 12 | 10 | 11 | 8 | 7 | 8 | 9 | 10 | 14 | 12 |
Click on the chart to see it in a larger format.
Disclaimer: While the accuracy of the information presented on this page has been checked, it is intended for guidance only. If data is required for scientific purposes, and with a guarantee of accuracy, please consult an official agency.
Please note too that there are considerable variations in climate across the Normandy region. The climate in Cherbourg, for example, or in Le Havre or Rouen, will show significant variations from that in Caen.


 Contact Us